NAMIC has partnered with Guy Carpenter to model the impact of potential risk scenarios on the mutual insurance industry. In 2023, property insurers faced a record number of catastrophic weather events. However, higher primary rate levels along with expected cooling of inflation should lead to non-catastrophe loss costs that are more manageable. In this latest round of testing, the adverse scenarios modeled were severe weather, financial crisis, and stagflation.
INTRODUCTION
For the third consecutive year, NAMIC has partnered with Guy Carpenter to model the impact of potential risk scenarios on the mutual insurance industry. This exercise brings to light some of the key risks facing our members today, as management teams attempt to navigate through a period of heightened uncertainty in underwriting and investment markets.
In 2023, challenges continued for property insurers faced with a record number of catastrophic weather losses. Amplifying this challenge, many carriers were caught between a highly regulated primary market, with many states limiting changes to rates and coverage, and a hardening property reinsurance market in which diminishing appetite for catastrophe (cat) exposure put more of the risk back onto carriers’ own balance sheets.
Complicating the challenges for many mutuals, auto losses continued to rise, as more people returned to their pre-COVID routines, driving another year of unfavorable auto performance for carriers. Looking to 2024, mutuals will continue to contend with reinsurance cost, but stand to benefit from higher primary rate levels, which, along with an expected cooling of inflation should lead to more manageable non-cat loss costs.
Asset market conditions improved in the last quarter of 2023, providing welcome relief to carriers. 2022 and most of 2023 were challenging for equity and fixed-income markets, exacerbated by the rapid rise in interest rates spurred by actions of the Federal Reserve. The recent uptick in asset valuations has been driven by an anticipated Federal Reserve (the Fed) pivot toward rate cuts in 2024 signaled by Chairman Jerome Powell, which would be a welcome change from the historic pace of rate hikes seen in 2022-2023. Asset markets have begun to price in a normalization of inflation and a soft landing in the economy, despite significant increases in borrowing costs over the past couple of years. Looking ahead, mutuals must remain vigilant to the risks facing their asset portfolios, as the Fed tries to successfully thread the needle between precipitating a full-blown recession and inadequately dealing with the inflationary forces that first arose in 2020. Mutual insurers stand to benefit from higher interest rates available today, compared to any time in the last 15 years, and they can use the buoyant market environment of early 2024 to reevaluate their allocation strategy and ensure it still aligns with their risk tolerance.

This article, written by NAMIC and Guy Carpenter, is reproduced with the kind permission of ICMIF Supporting Member Guy Carpenter. For more information click here.
Published April 2024
SCENARIOS
All scenarios that follow are hypothetical and not based on any real events that happened in 2023 or prior years. They are designed as a stress scenario distinct from expected performance.
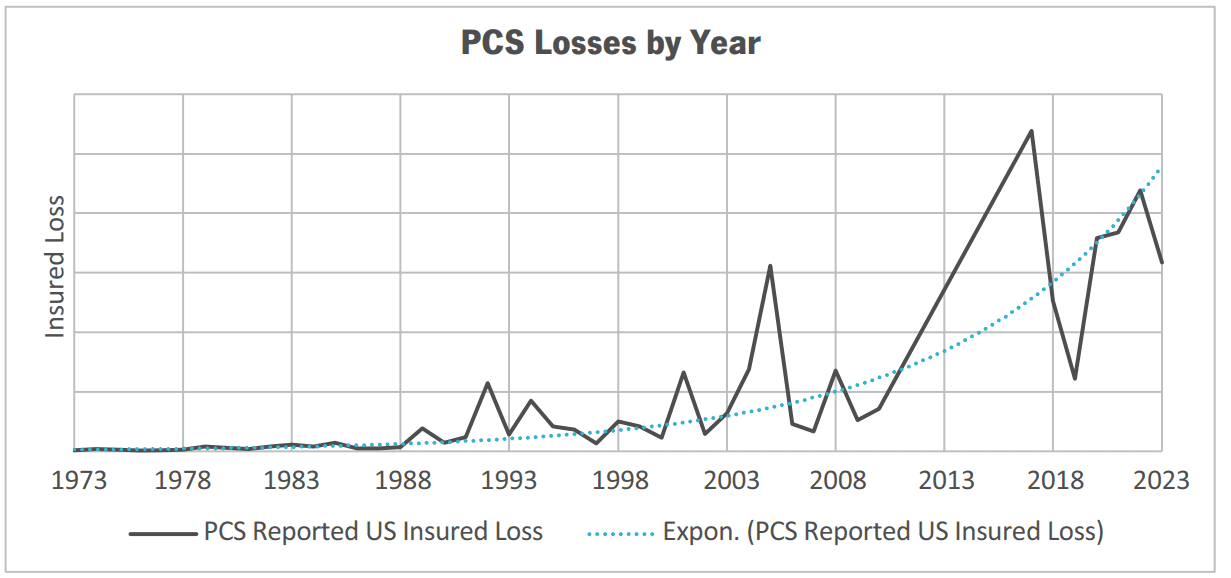
In the latest round of scenario testing, we modeled the potential impact of three discreet scenarios on companies across the mutual industry. In the Severe Weather scenario, we looked at the recent trend toward more frequent and expensive weather losses and attempted to predict what would happen if these trends persisted in the future. Stakeholders ranging from cat modeling firms to reinsurers to regulators have all recognized the trend toward more costly weather events. Commonly accepted views of the cost of weather risk, such as those indicated by vendor cat models, have risen faster than general inflation across nearly all major U.S. perils and regions. Weather-related losses have grown in proportion to an insurance company’s overall losses, changing the way companies price for and underwrite property risk. Risk of natural catastrophes now spans the entire country and is no longer a regional phenomenon. Despite the sharp increase in property losses tested in this scenario, we were encouraged to observe that severe weather had less impact overall than the other two financial scenarios we examined, as companies were generally able to absorb the elevated property losses using a combination of their expected earnings, balance sheet capital, and third-party reinsurance. As 2023’s storm season has shown us, the trend of increasing weather losses is not going away anytime soon, if ever. In response, carriers must be nimble in managing their regional concentrations, coverage and deductible levels, pricing risk loads, and reinsurance protection to ensure that they are not overexposed to this potentially severe risk.


The March 2023 collapse of Silicon Valley Bank and subsequent government-orchestrated takeovers of Signature Bank and First Republic Bank brought attention to the risk of a sudden contagion impacting the U.S. financial system. Not since the global financial crisis of 2008 has the possibility of a cascading series of bank insolvencies been so imminent.
It was the quick intervention by the Federal Reserve that stopped the contagion from spreading further across the banking sector and into the broader economy. Had the U.S. government not stepped in quickly to backstop anxious depositors, the depth and scope of the crisis might have been significantly more severe. For many insurers already dealing with a challenging asset market, these events brought into stark relief the risk of a larger liquidity crunch impacting their ability to pay liabilities due without selling off assets at distressed prices. The fixed-income valuation gap between statutory holding value and true market value highlights the liquidity concerns for carriers, should losses exceed available short-term funds. As of year-end 2022, the statutory holding value of all mutual company bond holdings exceeded the market value by $92 billion (8.2%). To model the impact of these factors, we selected Financial Crisis as our second risk scenario.
The financial crisis scenario reflects a sharp drop in the market value of equities, coupled with a spike in credit defaults for lower-quality fixed-income assets. This scenario also reflects the potential impact of a subsequent recession on a carrier’s premium production and fixed expense ratios. Because of the high exposure many mutual insurers maintain to equities and other risk assets, 21.1% of total invested assets in equities and alternative investments (typically reported on Schedule BA of statutory quarterly and annual statements) for mutuals versus 12.3% for stock companies, the financial crisis scenario has the greatest impact in terms of policyholder surplus loss of all scenarios tested, with mutual company losses totaling $85.9 billion. Carriers with ample liquidity and borrowing capacity would not need to realize these losses, but coupling a financial crisis with a severe cat event or other cash draw down could result in carriers being compelled to sell long-term assets at depressed levels. As the events of March 2023 have shown, mutual insurers must have a holistic strategy for managing the risks across both sides of their balance sheet.
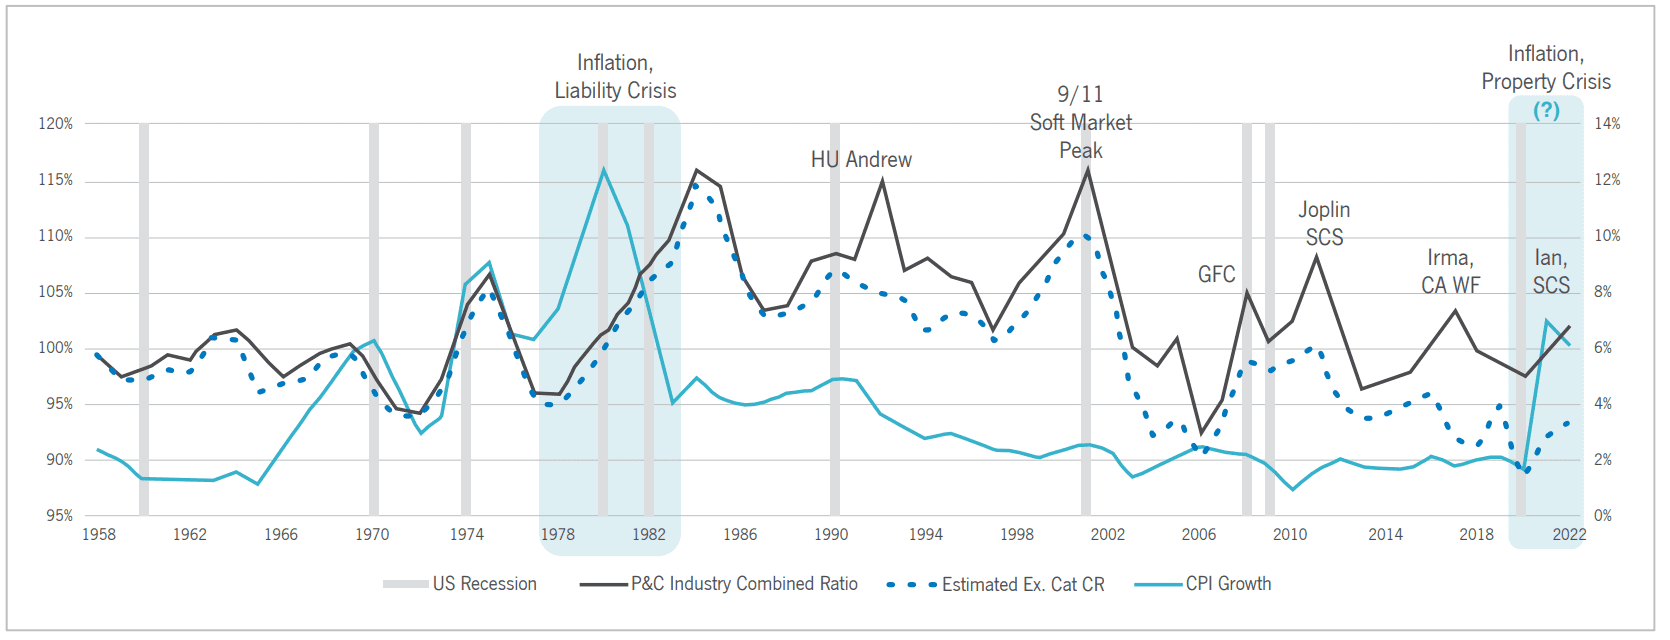
Another concern for insurers entering 2023 was Stagflation, an environment in which inflation remains stubbornly high even while the economy slips into a recession. The Federal Reserve’s rapid tightening measures taken in 2022-2023 seem to have forestalled rising inflation in the near term, but debt levels across the economy remain historically high, and risk remains for a reacceleration of inflation in 2024 if the Fed loosens conditions too soon. Long-tail writers are particularly exposed to the risks of stagflation, as real rates can fall below zero, and future liabilities grow faster than a carrier’s ability to pay them. The stagflation scenario considers a mild fall in value of risk assets, coupled with higher-than-expected loss development on in force business and balance sheet reserves.
One area in which stagflation differs from the other scenarios is that it tends to play out over an extended period of time, so not all losses would need to be realized in a single year. In prior market cycles exhibiting stagflationary pressures, such as the early 2000s and 1970s, companies have been able to underwrite their way out of stagflationary risk by realizing the deficiency of their reserves slowly over time.
These scenarios represent an opportunity to investigate thoroughly the potential risks relevant to mutual company executive teams and boards. Scenario testing has long been an important element of effective enterprise risk management strategy for insurance companies. Considering in advance how the landscape can change prepares management to act decisively and with confidence if these conditions arise unexpectedly in the future. Additionally, communicating a horizon of potential risk, estimating their effect on the business, and tailoring mitigation strategies to the board of directors helps prepare for survival and success during turbulent times. Beyond the stresses presented in this analysis, it is important to cast a wide net by engaging the broader management team on what risks are most significant to the business.
RESULTS
BASELINE
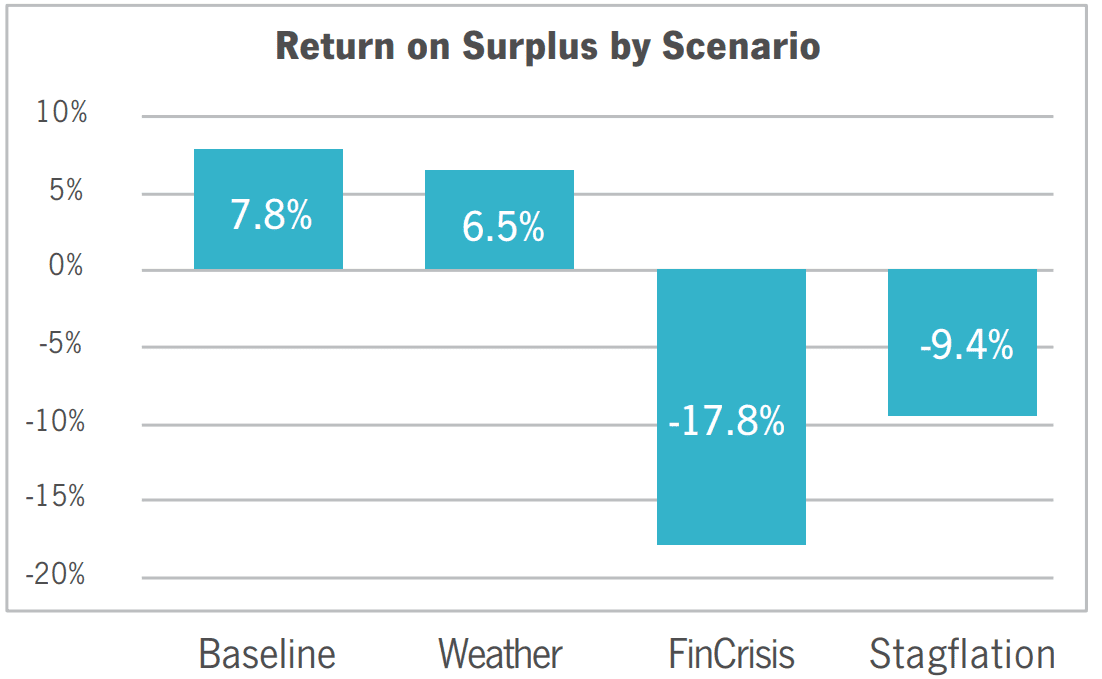
Return on Surplus: Mutuals are expected to grow surplus by 7.8% in the baseline scenario, compared to 12.9% pre-dividend return for stock insurance companies. The higher return that stock companies generate comes with elevated risk: stock carriers on average have higher operating leverage and a higher volatility business mix versus mutuals. As a whole, mutuals are more defensively positioned for long-term sustainability versus stock companies.
Volatility: Mutuals are expected to have lower volatility for the year in potential performance, with 12.5% average standard deviation of modeled policyholder surplus compared to the average stock company’s volatility of 16.8% of year-end policyholder surplus. This result further corroborates mutuals’ focus on long-term sustainability over short-term gains.
WEATHER
Increases of 31% expected weather losses across all perils and regions versus baseline is an earnings stress, not a capital stress, for the vast majority of mutual insurers. In fact, only 4% of additional companies are expected to lose surplus on average in this scenario versus the baseline. The elevated cat-loss activity experienced in recent years coupled with the hardening of the cat reinsurance market has driven many companies to reevaluate their appetite for underwriting property risk. Common carrier actions to mitigate exposure have included more frequent assessment of replacement costs, use of larger deductibles, including roof endorsements limiting coverage for cosmetic damage and/or older roofs, greater use of facultative reinsurance, and reduced availability of admitted products in high-risk regions. Though higher cat risk can be managed through pricing and geographic diversification, the increasing trend in cat losses acts as a headwind to profitability, increasing the volatility of underwriting results. Most companies have needed to raise their reinsurance retentions in recent years, further increasing net volatility; a 1:20-year cat loss year for the average property exposed mutual company increases from 5.9% in the 2022 model-year baseline to 13.2% in the 2023 modeled weather scenario. Overall, mutuals expect to lose 1.3% of surplus from this scenario compared to baseline returns, with southern companies exposed to a greater share of the increase in losses, losing 1.6% of surplus.


FINANCIAL CRISIS
The Financial Crisis scenario reflects a severe financial shock that reverberates through the broader economy, resulting in 17.8% of surplus loss that would require 3.9 years of average return to recover. This scenario has the largest balance sheet impact of the scenarios tested and puts the most strain on larger national companies. Northeast companies that tend to have higher equity allocation experience the second-largest drop in surplus, losing 17.1% of surplus in this scenario. Midwest companies perform relatively well by comparison, losing only 11.4% of surplus, a loss that would take on average 1.6 years from which to recover from. Similarly, those companies that write greater than $2 billion in premium are most vulnerable to surplus loss in this scenario, while the smallest companies, writing less than $20 million in premium would lose just under 10% of surplus. The Financial Crisis scenario serves as a good litmus test for a company’s tolerance for investment risk. Companies with high allocations to equities and other risk assets would be well served to examine how they perform in this scenario test and, if their exposure is out of step with management tolerance, consider de-risking their asset holdings. Since the Financial Crisis scenario significantly targets falling equity values, the total available capital decrease is somewhat offset by a lower B2 capital charge. Mutuals experience an average loss of available capital of 23.3% in this scenario, with an additional 4.6% projecting their AM Best’s Capital Adequacy Ratio (BCAR) score to drop below the critical 25% threshold, the minimum level for the “Strongest” Balance Sheet Strength Assessment.
STAGFLATION
An economic downturn and high interest rates create strong headwinds for insurance companies looking to achieve sufficient rates of return to meet their cost of capital. Mutuals are expected to lose 9.4% of surplus in this scenario, reflecting the increased present value of future loss payouts. This scenario also contemplates a simultaneous increase in bond default rates, a 21% haircut to equities versus baseline, and a slight premium contraction due to lower economic activity. This confluence of events is projected to cause two-thirds of companies to shrink in surplus over the year, compared to just a quarter of companies at the baseline. Of those two-thirds of companies that lose surplus, more than half would lose more than 10% of surplus in the single year and one-fifth would lose more than a quarter of their surplus. Mutuals overall are expected to take 2.5 years to recover from this loss. Long-tail lines of business are particularly sensitive to this scenario. Commercial casualty writers are expected to lose the most surplus (10.1%) with commercial property writers performing relatively well (6.1%). Additionally, the increase in balance sheet reserves causes this scenario to have the greatest impact on BCAR of all scenarios tested. The average mutual company is expected to lose 15.9% of available capital versus the baseline, with average BCAR scores expected to drop by 5.4%, driving 10.4% of Mutual companies modeled below the minimum level for the “Strongest” Balance Sheet Strength Assessment.


CONCLUSION
Years such as 2022 serve as a good reminder that multiple adverse events can happen at one time, reinforcing the range of parameters that needs to be considered when setting a company’s tolerance levels. By examining various scenarios, both real and hypothetical, insurance companies can prepare themselves for new risks on the horizon that may pose a threat to operations in the future. By helping companies move beyond siloed departmental risk management, scenario testing analysis aims to provide broader insights that facilitate a discussion on the correlations and co-dependencies between the different sources of risk to which an insurance company is exposed. Proper balancing of these risks, attuned to the specific mission and characteristics of the company, is critical for ensuring long-term resilience.
Quantifying risk by component and the interactions between risk drivers is a requisite step for informing mature risk-tolerance statements. For example, in the current market environment, a company with large cat exposure may wish to de-risk its asset exposures to capitalize on hard-market underwriting opportunities, while a company with low written premium leverage may wish to focus on returns from equity markets and higher yield fixed-income opportunities. Given the inherent risk in investing and underwriting, management can focus on the factors and levers that they control and, importantly, achieve board and executive level buy in on selected risk tolerances and approaches to managing the unknowns.
NAMIC and Guy Carpenter have collaborated to provide this scenario testing analysis for the benefit of mutual insurance companies and the broader insurance industry. We encourage each company to examine how realistic scenarios such as the ones described herein would impact operations; communicate proactively with their boards on the range of potential outcomes; and connect with their trusted advisers for further insights specific to their own unique circumstances.


