Ben Telfer:
Hello everyone, and welcome to today’s ICMIF webinar, “Reimagining motor insurance the mutual way”. Thank you for joining us today to hear from LB Group and how they are reimagining their motor and mobility offerings to serve their member policyholders. I’m very pleased today to welcome Robert Kielerstajn. Robert is co-head of LBeta Innovation Hub at LB Group. Robert, thank you for joining us today, and I’m pleased to hand over to you.
Robert Kielerstajn:
Thank you, Ben, and thanks so much for giving us the opportunity to share some views and thoughts from us. So, hi everyone out there. It’s my first time doing this kind of setup, so I hope it will be valuable for you as well. I thought I would start out with a couple of really quick facts about LB, in case you don’t know us from before. I’ll just see if the slides are working.
LB is based in Denmark. We’re the third largest insurance company for private individuals. We have approximately 400,000 members, just shy of 10% of the people living in Denmark. We’ve grown recently, so we’re now about 800 employees and almost 500 or about 500 million US dollars in gross premiums. We pay loyalty discounts annually. We’ve been paying about 64 million since 2015.
We have four different brands and they are tied to various industry groups. So we have the biggest one is for teachers and pedagogues, but then we also have healthcare employees and a couple of other major trades and professions. And locally in the Nordics, LB is renowned for its really good member service and our obsession with providing a good member experience. That’s a little bit about us.
To help keep you energized the today, we prepared a few questions and I wanted to start with a really simple one, and that is, I’m curious where you are tuning in from. So you will get in a second you should be getting a pop-up question from Ben, and you can answer either if you’re from the Americas continent, Europe, Africa & Middle East, or Australia-Asia.
There will be other more insurance and mobility and motor insurance related questions further on, so this is just to warm us up. I think we’ll give you maybe five more seconds to answer, and then hopefully it’s popping up on your screen so we can see the results.
Ben Telfer:
You should see it. It doesn’t seem to be popping up, but you’ve got, I’ll just read them out, it’s 45% Americas, 50% Europe, and 5% Africa & Middle East, and, unsurprisingly, seeing it’s the middle of the night, nobody joined us live from the Australia and Asia region.
Robert Kielerstajn:
I’m honored that you’re joining from all across the world. Now, continuing on, I’ll just show you the agenda for today.
When I was preparing this, I had two major reflections that I wanted to start with. One is that when we talk about motor insurance in LB, we also started to talk about mobility in general because it’s quite tight and there’s a lot of exciting things happening in mobility. There’s also a lot of information about it out there in the world, so you have both from insurance companies, financial firms, and the big four.
There’s a risk of going around in circles and just repeating the same trends all over again, and I really wanted to avoid that. So for today’s session, I prepared what I’m hoping is a slightly more personal and insider view on how we are working and some of the research we’ve been doing and some of the thoughts that we have.
I’m hoping it will be slightly different from other mobility and motor insurance seminars that you can go to, and also to manage your expectations. I’m really sorry, but there’s no easy answers or no recipes, so I’m afraid there could be more questions than answers during the day, but I’m still hoping it will be interesting for you.
These are the topics that we’ve prepared, and so I’ll just quickly go through some of the recent LB events that we’ve been working on, and then I’ll also touch on some of the trends that we’re observing in the market. But then what I really wanted to share with you guys is we’ve done some research with our members here in Denmark and what they say and think about mobility and motor, so I wanted to show you some of those findings. And then we have a big telematics or a small telematics program, but that we’re really excited about, so I wanted to give you a sneak peek into that. And then hopefully we’ll have some time to go through some questions.
Jumping onto the things that we’ve been working on here in LB. So in 2019, we launched a new car insurance offering, which isn’t as a exotic as you could hope for, but for us it was quite a big milestone because it was in our new core insurance system and in our new digital web portal, and so that was quite a feat. The new car insurance, it’s a revamp of the old product that we had, so we added new covers that we could see people were asking for, and we made it more digital, more automated, and a bit more eloquent on the pricing side. So a lot of good healthy things.
Then in the same timeframe, we also added a green car discount, which is based on the new green end cap rating. So for cars that get the highest rating, they would get a straight off 75 Euro premium discount on an annual basis, and that’s something that we’re experimenting with more in the sense of that green mobility is high on the agenda here in Denmark, and so this was one way to plug in and also to see what interest and reaction it would generate from our members. And we’ll come back to the green agenda and electric cars a bit later on.
We also launched a new exciting product also to experiment, which was a car sharing insurance. So we have in Denmark car sharing schemes, as I imagine you have as well in your countries, or at least in many of those. We have a couple of different ones and LB Group is not directly involved in any of them, as I think most of them they offer embedded insurance through some of our competitors that are not member alliances, so they can offer it to anyone, regardless of who’s the driving customer.
But what tends to happen is that you get a very, very basic insurance, part of the basic price for using a car, whether it’s by hour or kilometer or day, and then you can opt to buy more, and it’s quite a good business for the other insurance companies that are behind it and it can add up to quite a bit of a cost if you’re using these schemes on a regular basis.
But what we tried to do is to launch a car sharing insurance that you can buy from LB Group, if you’re an LB member, and that would cover you regardless of how many cars you use and how many schemes you’re using. So it would cover you across all of them, and it would be for a very modest 7 euro monthly price, and you could turn it on and off at any time. And so we’ve had moderate success with that, and we’re evaluating how we could grow that market and that business and plug into the new mobility solutions.
The fourth one is we launched a smartphone telematics program focusing on prevention, and I’ll come back to that one today. So I won’t say much more about that now, but you will get a lot more details a bit further on.
That was a very quick review of the major events that we’ve had, and now I’ll go through and talk about some of the trends. I won’t go too much into detail, but we’ll come back to it later on. So we are seeing different new types of mobility solutions. One example is Lynk & Co that is launching a subscription based model, which is in line with the Netflix DNA that you can subscribe for a month and then if you like it, you continue or if not, you don’t. And it’s very it’s exciting. And it’s also somewhat challenging the traditional business model that we have, which is primarily based on private ownership, so it’s definitely on our radar.
Then the next example that I included is a Tesla self-drive, and there are other competitors as well. There were two recent events after we prepared this material for you guys. One was Tesla reporting that they’re starting to get numbers on how many accidents their cars are involved in, and I think they were saying the risk was five times lower compared to other cars with the safety features, and 10 times lower, 10 times fewer accidents, for cars that are using the autopilot and beta mode. There was also, on the flip side, there was a tragic accident where two people passed away also driving a Tesla.
That’s the kind of news that’s hitting us, and of course we’re monitoring the level of autonomy and also debating how that will impact the traditional business model. We’re seeing reports from various firms saying that maybe around 50% of accidents could be avoided and therefore also the claims cost and premiums would disappear. And in Tesla’s case, we understand that they’re also launching their own insurance, so that’s also a trend that we’re observing.
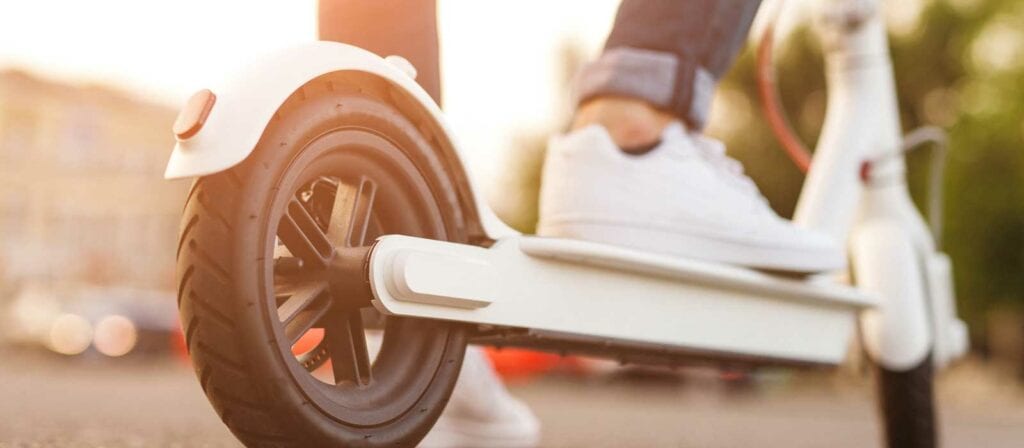
This other one is a guy called Kim that we interviewed on the streets outside our office. So Kim is commuting by public transport, primarily train, and as you can see on the picture, he also buy what we call electric scooter, so you have these schemes where you can rent them and use them on an hourly basis, but people are also starting to buy them to use as part of their commute, which is quite a funny feature. And in his case that was an alternative of instead of walking between the train station and work, which took a bit too much time, but on the other hand, it was more convenient than taking a bicycle on the train, which was a bit of a hassle and stressful with taking too much place. So we have these new patterns of life emerging of how people move around and what type of transportation mechanisms they use.
Another example of that one is the post office that is experimenting with these macro electric bikes. So they’re converting an electric bike into a new type of hybrid vehicle that can help you transport post and packages, and this is another person that we saw on the street and stopped and gathered for an interview to find out more about what they’re doing.
I think I have one or two more. There’s another Danish company called Holo, and that also has autonomous solutions, autonomous software, and a couple of new blocks in Denmark and then in some other European cities, they have pilot projects with the local cities to experiment with self-driving buses, which are slightly smaller than your traditional bus, and for now they’re going at low speeds, but also promise a revolution in public transport.
Then final one is this robot that Nova Nordisk, which is a big global medical company based in Copenhagen, is using. They have a huge campus with a lot of different sites and they have these autonomous robots that are actually in traffic now and driving between sites and delivering materials and tests and so on.
So there’s a lot of exciting things happening that are changing the landscape and the vehicles, the patterns, that we’re using. And this is some of these examples are part of a larger analysis that we did last year that was a starting ground for to shape our thinking about mobility and the solutions of the future.
Now moving on to the next chapter, we were quite keen to talk to our members and understand what are their thoughts about mobility and how is their everyday life, and are they using some of these new trends that we can see? How is that impacting and how common is that among them? So as part of the work, we did a couple of different things, but we interviewed a few different members with different kinds of attributes and ask them how’s their life? How’s their transport? Do they own a car? How do they move around? And then we asked them around what’s working well, what’s irritating, what are your pains and gains? And then we took those answers from interviews and we tried to structure it and put it into some categories, and these are the broad categories that we found. You can read them here.
But there’s something around convenience and time and cost and safety, but also around health, environment, and your experiences and self-actualization, and a reflection is when we approach things and when we do product development and service development, we typically start with safety and cost, but we could see that that’s just one out of several categories that our members are experiencing on an every day, and there all pains and gains within all of these.
We have one more question coming for you guys, and I’ll read it out loud and then give you some time to respond. So we would like you to think back to your everyday trips and besides the destinations, what is important to you? So is it that the trip should go as fast as possible or as safe, or as convenient as possible, or maybe that it should be as environmentally friendly as possible, or to be as healthy as possible to get fresh air and exercise. So you have five options, please select one.
This question, in Danish, we post to our members and I thought it could be funny to see how you guys replied versus how our members replied. We’ll give you just a couple more seconds and then we’ll hopefully see your results and we can compare it to our LB members.
All right, so let’s see. We have convenient is on top followed by safe and fast, and then in the bottom two, we have exercise and environmentally friendly. Interesting. So convenience, safety. Now, if we compare that to our LB members replies. Let’s see if I can get the control again. So this is how our members rated them. So you guys had convenience on top, I think ours had fast and then we both had safe, and environment and healthy at the end. So it’s quite similar, which is interesting. So it could indicate that there are some global trends, global driving forces behind.
What we also asked our members, and we’re not going to ask you this, but a follow up question from our side was, what would you like to change? And in our case, we started to get some interesting results. So in our case, people said that fast is really important and that’s also what they would like to improve, so that was also on top. And then they said they would want trips to be more convenient and more environmentally friendly, and then safer came second from bottom and healthier was right at the end just as before.
This was one aha moment for us, and especially the fact that safe was number two with our members. It was also number two with you guys just now. But when we asked about what to change, it’s actually at the lower end, so it’s indicating that people value safety and it’s important, but they’re also quite happy with the level of safety. It’s not at the front line. And this is what we got from the survey in a quantitative way and it’s also the message we got from the qualitative interviews.
The surprising factor, or the aha moment for us, is that when we work, safety is actually usually the foundation for us or the entry point when we debate new topics and new products, because obviously that’s the inside out perspective. So we have all the data on the claims and the accidents and that’s how we approach. But we started thinking that maybe we have to think differently and maybe we have to complement our inside out with an outside in view.
We did one other thing. We continued on this path. So we also asked our members some more questions. I think it’s coming up here. Yep. So this one is slightly longer, so it will take a minute and I’ll guide you through it. There’s no right or wrong, and it’s not a trick question. We’re looking for your intuitive answer and your preference. And I hope you can bear with me, but we just thought it would be interesting to see if you replied the same as our members did. So imagine that you’re on your way out and you’re going to popular a shopping mall, and there’s no corona, but you have a few different options for how to get there. Now, which one do you take?
Option one is to take the Metro, nice and easy, and you walk from the Metro to the mall, and it will take you about 35 minutes. Option two is that you take the Metro and the bus and the bus will stop just outside the mall, but obviously you have to switch in between. And that will be a little bit faster, it will be 30 minutes. A third option is that you take a Metro and then one of these electric scooters that you saw before, so you’re exiting in the Metro station and then taking the scooter instead of walking, that takes you 25 minutes, but then you have to go onto your app and find a free scooter and then rent it and so on. And the fourth option is that in this case that you take an electric car share. So you were never on any public transport. You find your app, you find a car, you walk to that one, go to the find a parking, and get to the mall. And that takes you 25 there.
You have four options, Metro, Metro and bus, Metro and scooter, or electric car share. What would you select? Which one would you take? I’m hoping you’re not too bored with this. And I promise there is some deeper insights. So maybe three more seconds to answer and then we’ll see the results.
Right. Interesting. So number one, taking the Metro. Number two is taking the electric car share. Three is the metro and scooter, and last is Metro and bus. So, it’s fascinating, but we actually got very similar results. The ranking is the same, but the proportion that took the Metro was even higher in our case, it was towards 70%, and what we did was we had a couple of different questions like this, so we were experimenting with the different options and with how long it takes and how the cost is, and if Daniel Kahneman and Dan Ariely, and those, we were trying to raise questions like that, and what we were finding was that even though a trip took longer, as in this case the Metro is actually, if you value speed, the Metro is the worst option because it takes you 35 minutes, but still a lot of people, you guys, our members, prefer the Metro.
In general, the theme was across all these questions in our bigger survey, that when we ask people about their real life cases, convenience just dominates. All of the others disappear. And that’s just a very interesting dynamic. And we also had all of them got one question where we supplemented those options with a car and an 80% selected car, traditional car, when they had that option.
Coming back to the original categories. So what we’re trying to do on our side is to understand what are the dynamics between these different categories, because it’s definitely not linear, and there is something… All of them are relevant, but there is something very special about convenience that is really having a big influence. And it was the second aha moment in the work that we were doing, because convenience is something that we never think about as a insurance company and even in the innovation hub where I’m sitting, it started framing the work that we’re doing. So we started debating, our inside out view was safety, but when we talk to members, we can see that convenience is really high on the preference, and then we also have to look at the other dimensions, time, cost.
Could we use that in some of the new offerings that we’re working on? We continued to ask our members about some of the new trends that we’re seeing, and so we asked about how many have used car sharing schemes, and 5.2% had used them. And this is one view that is also looking at age, and you could see that actually it’s quite even across the age groups, the biggest one is 30 to 49 year olds that are using car sharing, but actually all of them are represented, so that was interesting. So it’s still new, it’s still up and coming, but it’s becoming significant.
Then we asked how many have used one of these electric scooters and it’s slightly lower, but again, the same pattern that it’s represented in all age groups, but 30 to 49 year olds are the ones that are using it the most. So we’re starting to see a pattern. And then we asked about electric bikes, which is really big here. I’m not sure in the different cities that you’re in. And again, similar pattern 4%, so it’s still new, but it’s becoming significant, represented in all age groups, and actually quite popular in the slightly higher age groups, in the more seniors. So again, we got some interesting feedback that we continued working with.
In parallel to this, we were also looking at what’s the development of accidents in Denmark, and I would be surprised if it’s significantly different in your countries. And we got this quite interesting statistics and some of this is in Danish, so I’ll just guide you through it. So these are people that were actually killed in the traffic, so deceased, and it talked at 1200 people killed in the 70s, and then it goes down. And it goes down in parallel to the kilometers driven drastically going up and the population size, so the relative proportion is dramatically going down, and this is helped by we included the major breakthroughs, so it’s speed limits, seat belts up front, helmets for motorcycles, seat belts and airbags, and then harsher penalties, and just recently now using phones handheld became illegal in Denmark.
When we zoom out, the trend is very positive. When we zoom in, we can see that in the last 10 years or so, it’s actually very stable. So every year there’s about 200 people that tragically pass away in accidents, and about another 2-3000 that have serious traumatic accidents, and many more that have lighter accidents.
For the deceased and serious accidents, the data is very, very secure, very, very good quality. So this was quite interesting for us. Even though there was a very positive trend, there’s still a lot of potential, there’s a lot of a pain and trauma that we could save if we could prevent this.
Then we’ve double clicked on these numbers, and we were trying to see, where are these accidents happening? And so obviously a lot of it is in personal cars, and so I think it’s 61% of all the time spent transport is done by cars, about 41% of accidents.
One item that jumped out here was that actually bicycling has more accidents compared to the time in traffic. Bicycling in Copenhagen and in Denmark is quite popular. So it’s quite popular and it’s very positive in many, many ways, but it also seems to be risky.
Then when you double click on bicycles, you can see that in the last couple of years electric bicycles are having a really big portion of the number of accidents, because the number of electric bicycles are still small but the proportion is becoming significant. And if you look at the sale of electric bicycles, it’s booming. So it was very, very small, and last year it was 60,000. So you have this exponential curve.
What we’re sitting here and doing is putting these pieces together, and then we end up with this. So we have this massive push for green mobility, including cycling, from people, from politicians, and various organizations. And electric bike bicycles, they’re convenient and we can see that convenience is really, really high up, so the sale and use of electric bikes is booming. But the infrastructure is not really keeping pace, so not only do we have bikes and electric bikes, but you also have the scooters and the hoverboards and other new hybrid vehicles and they’re all in this one section of the physical road, and that’s part of the reason why the accidents on the electric bikes are disproportionate and really increasing.
But at the same time we can see that people are actually not worried about their safety, they’re quite happy, they experience it as safe enough, even though we might see something different in the data. And these five pieces together really got us thinking, we’re super positive about bikes and electric bikes. It’s good for the environment. It’s good for your health. It’s good in so many different ways that. But it also carries some risks and it’s a type of risk that maybe we can see, but our members can’t see. So it’s also a huge opportunity to keep them safe.
In LB we have recently launched a new purpose saying that we want to make insurance as we know it today redundant together with our members. If we could help prevent accidents and damages from happening, rather than just accepting them and paying out, we would much rather prefer to do that.
This is the question mark I had in the beginning. We don’t have the final end recipe for how to move ahead, but we have all these questions to say, okay, knowing this and seeing these patterns and knowing we can see some risks that our members are not seeing and the they’re may be not concerned about safety, but how can we best help them to keep them secure and not just insure our members while they’re on the go, and how can we use behaviors based on these insights, but without scaring people off? And should we have a role in the political debate about how to create political incentives and taxes and direct funding and so on, or should we develop some very local, specific, solutions where we can combine convenience and safety, and, for example, for people that are using eBikes, because this seems to be one of the new booms.
Maybe for you guys tuning in or looking at the webcast afterwards, is could we experiment on some of these things together across the network? Because I know, at least in quite a few other European cities, bicycling and electric bikes are also taking off.
These are some of the things that we’re thinking about, and I’m really sorry that we don’t have the final solution, but we’d love to come back and present you with some of the results when we have those up and running.
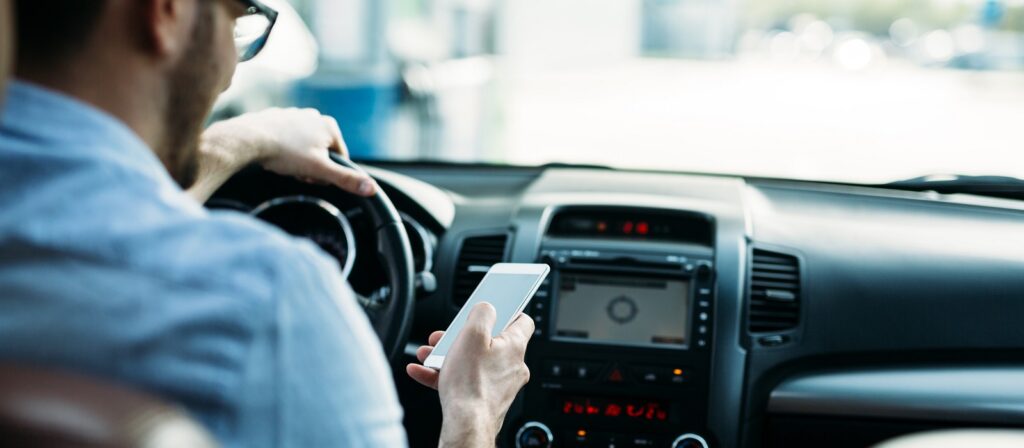
I have one more section to show you, and we do have some time left. And the next section is around telematics program. So we touched on some of these topics just before. Every year we have on average 200 people that pass away in traffic accidents. The authorities here estimate that roughly half of those cases is because of distractions by using mobile phones when driving. And obviously the people losing their lives is very tragic. There’s a lot of also tragic accidents that don’t resolve in casualties, but still terrible things happening and people getting injured and families and friends being affected.
Members have approximately 30,000 car collisions every year, and then supposedly half of them are caused by people using their phones. So that’s huge numbers that if we could help change that in a positive direction, that would be really meaningful, and if we could find an economically viable way of doing it, that would be really, really exciting.
These were some of the thoughts that people had years ago now, which ended up in this pilot program for using smartphone telematics. And so these are some of the screenshots from the solution that we’re offering to 5,000 of our members now that are part of the program, so that it is telematics, but it’s only using the smart phones, so the telematics partner that we’re using has algorithms that are clever enough to classify movement as whether it’s a car trip or not a car trip, and whether you’re driving or not driving, and then if you are the car driver, then that trip becomes part of the program.
We have as much as many other telematics programs have they, there was a scoring model behind and you get a safety score, and the biggest factor in that safety score is whether you’re using your phone or not, when you’re driving. So we’re trying to address this really big issue that we have. I’m telling you about it, but I’m also one of people that are sitting and using the phone every now and then. But we launched this a few months ago after quite a bit of time preparing it and building all this, and we’re really excited to have this up and running.
I have some results that I wanted to share with you. I think we’ll go for maybe five more minutes before we’ll pause for questions. So we launched this and we got members from all over Denmark and across all the major car brands, fairly similar to our general portfolio. We have a 60/40 split between men and women, which we’re also quite happy with, so we’re quite equally represented in the different groups.
We have one final question for you guys, just to keep you energized, and the question is, what age group do you think is the most popular that has signed up for this app? So is it people age between 20 and 35, or is it people aged between 35 and 50, 50 to 65, or 65 plus?
We offer this to many thousand of our members and the first 5,000 that signed up, got this. So which one do you think? Which of the age groups has been the most keen to sign up? You’ll get three more seconds.
All right, so, 35 to 50, that will be quite in line with the earlier results when we were looking at electric bikes and so on, and then the young group is second place, which makes sense because they’re young, and then you have the 50 to 65 in the third place, and none is voting for the 65 plus. So I’m guessing that’s a stereotype on this that we also had, and now I will show you the results. If you go back to the slides. And this will potentially blow your mind just as it did with us, and you can guess what’s coming. The most popular age group is the 65 plus.
We have between, on average, 8-9% in the other age groups, but the 65 plus we’re above 10% people that are signing up. So our high-tech, smartphone, sensor-based, machine learning, telematics app, is popular among seniors. So this was another one of these crazy aha moments that we had recently.
We’re fundamentally reevaluating how we work and what our assumptions are and I’m hoping you’re finding it equally interesting and funny as I am. I can’t keep from smiling, presenting these facts. But live and learn.
Moving on, I wanted to show you some of the results that we’re getting now. So we’re measuring how often are people using their phones when they’re having trips, when they’re on trips, and how much time are they spending using their phones as well. So how often and how much time. And the good thing is that it’s falling across all the different KPIs, so we’re really, really happy about that.
We can see that approximately 40% of all trips, people were using the phones when they begin, and that drops to about 30%, so it’s positive, but there’s still a lot of potential left. But on the other side, the timing used on the phone is dropping with 50%, so that we’re really, really happy about, and it’s indicating the scenario that people are driving, and they’re getting calls that they’re replying but then they’re stopping the call much quicker than before because they’re hopefully aware that this is causing a distraction, their score will go down. And we’re hoping that this concept is called, is nudging them in the right direction. We’re thrilled, and we’re monitoring the progress.
Just introducing a slightly, or coming back to an earlier topic, so electric cars that we were giving a discount and that are also part of this program, just as in many other countries, they’re booming in Denmark now, Denmark was slightly slower to adopt electric cars compared to Norway and Sweden and some of the neighboring countries, but now we’re really seeing that uptake, and we have some of these electric cars in our program as well, in the telematics program that we’re talking about.
We had this question that you probably have seen in your media and newspapers as well, whether can we see that there are more claims and more accidents with electric cars? And is it because people, they have to learn how to operate and drive electric cars and the acceleration is very different? And now, with the help of this telematics program, we could actually get hands-on data facts on what’s actually happening.
Using this telematics, we can see that the average size of the acceleration is roughly the same across all the different fuel types when we’re comparing petrol, diesel, and electric. And actually, the maximum acceleration is lower for electric cars, so the really aggressive outliers, they’re far more aggressive with the ones driving petrol and diesel and not at all for electric.
But the average number of accelerations is three times higher for electric cars. So this is your day-to-day acceleration when you’re starting your car or parking, or certainly out on a highway. So this is really proving the hypothesis, but it’s also providing some nuances that it’s not necessarily speed crazy people, but just people that have to adjust and adopt to how the electric cars are working.
That’s also telling us that there should be a lot of opportunity for us to plug in and help them and work with our members, and much like before, when we were talking about electric bikes, when we’re talking about electric cars, we’re left with these kinds of thoughts. Knowing this and having these insights where we’re sitting, collecting all the data, can we start to work with our members? Can we share the insights, but use them to nudge behavior and not scare people off? And can we work with the members to help them prevent and avoid accidents, and thereby also reducing the claims cost, which we could do to give back to members with lower premiums.
There is an amazing snowball effect that could be realized if we can crack the code. And to do that, most likely it has to be convenient because we do know that people are not triggered by safety necessarily, so it has to be packaged in something that’s convenient and is attractive for our members.
That’s what we had prepared for you guys today.
Ben Telfer:
Thank you, Robert for a very entertaining and informative presentation. Before we get to any questions, I just want to reiterate your point about asking any members to contribute to this project, and if anybody listening would like to share data and share experiences with Robert and his team at LB Group, please do get in touch because I think that is a great initiative and something we would help to facilitate and basically is the purpose of ICMIF, for our members to come together and share best-practice.
A couple of questions I’ve got in. If you’re in the audience and you’d like to submit any more, please do. We may not have time to ask Robert today, but we can follow up afterwards with him.
First question, actually, Robert, is one I wanted to know about, was about the uptake amongst the 65 plus age group. You said it was a surprise. Did you find get any feedback or any questions, any interactions, from those why it was so high amongst the senior citizens?
Robert Kielerstajn:
We haven’t. We’re still stunned that it’s so high, but we’re slowly hearing that it’s actually similar also in other areas of society, so also in digital newspaper subscriptions and other unrelated areas that older people are just more digitally savvy than the stereotype, maybe, thinks.
We’ve had some interactions with members through this program, but there’s no one easy or simple argument why they’re interested. I think it’s maybe the opposite. Why wouldn’t they be? I think it’s a myth that they’re not potentially comfortable, but apparently they are and they all have smartphones.
Ben Telfer:
Thank you, Robert. Yeah, it’s surprising. Like I say, it doesn’t live up to your potential expectations. Another question I’ve got here for you, Robert, we’ll turn back to one of your first questions about the five things, about a journey: about being it fast, safety, it’s convenience,etc: the question is you left out the cost of the journey, was that done on purpose or do you think cost is not a factor?
Robert Kielerstajn:
In this one question, we left it out to keep the comparison fair. I didn’t ask you guys either today. In other questions we did have cost included, so we do think it is a important factor.
Ben Telfer:
Another question for you, Robert, is about the climate-friendly discount that you mentioned at the start. Do you have any data on the uptake of customers for that or the potential impact that has happened as a result of it? And if you don’t have any data of it, what are your expectations and targets?
Robert Kielerstajn:
As far as I know there’s still a rather few cars that are classified with the highest green end cap rating, and that has led to a few cars and car policies receiving this discount, but not a massive rollout. But the ones that were authorized and received a discount, they were obviously very happy.
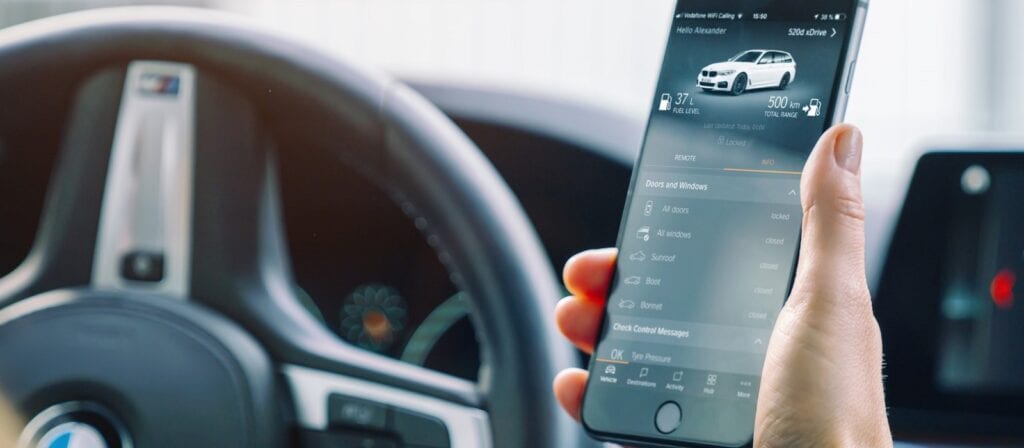
But what we’re doing now is to see if whether we should just tweak the mechanism a little bit so that we can provide the discount and reward green cars even though they’re not the highest end cap rating, but just go directly on the data that is provided by the car, because we do have that and we can get that through APIs so we can reward more green cars on a wider scale. So that’s something we’re looking into right now.
But the uptake has been fairly limited, but due to the number of cars that have received this rating, and I understand that’s a process for how long time that takes.
Ben Telfer:
Sure. Now I think we’ve time for one more question, Robert. You mentioned or you referenced some behavioral psychology in how you’ve gone about your work. Do you have any other examples of how behavioral psychology and behavioral economics has been used in any of your product design or proposition design?
Robert Kielerstajn:
When we launched this innovation hub, we hired what we call a behavioral scientist, sometimes it’s called a behavioral designer. And we also hired a data scientist and a business developer. And we put those three in a room and I promise you magic happens. It’s really, really amazing, so if you haven’t done it, those of you guys listening, you really, really should. We have tons of examples, but one that pops into mind is for this telematics program. Another hot topic was about GDPR and data privacy. And so there’s different angles to it, but obviously we’re asking members to allow us to follow them in their daily movements. Some think that’s quite okay, others think that insurance companies should stay out, and I don’t trust you to use the data, and will you reject my claim or will you report me to the police if I’m speeding? And so on.
We had my behavior colleague, he was tweaking that. So we were experimenting, talking with members and experimenting with the communication, and we weren’t changing the technical solution behind, but we were changing how we communicate around it, and we went from people being really concerned and 50/50 positive/negative, to reaching a communication where a majority were very comfortable and trusted us how to use the data and so on. And that was all thanks to M. Thomas. So that’s one other example, but we use it everyday in the work and it’s really, really, really valuable.
Ben Telfer:
I’m afraid that’s all we’ve got time for today. If anybody is watching this recording and would like to ask Robert a question, or if I haven’t got to your question today, please do follow up with myself and I’ll be happy to pass them to Robert and I know Robert and his colleagues, they’ll be very happy to share.
The above text has been produced by machine transcription from the webinar recording. ICMIF has made every effort to ensure that transcriptions are as accurate as possible, however, in some cases some text may be incomplete or inaccurate due to inaudible passages or transcription errors. Listening to or watching the webinar recording will allow you to hear the full text as delivered during the webinar but this is available in English only. Our transcriptions are provided to enable members to select the language of their choosing using the dropdown menu above.