Mike Ashurst:
Hello everyone. I hope you’re all well. We’re delighted to be joined by so many of you on today’s webinar “From thinking about climate risk to taking action”. In this webinar, we’ll look at the different aspects of how climate change may affect your business, using the six step Willis Towers Watson climate change framework as a guide. We’re pleased to be joined today by three speakers from Willis Re, one of ICMIF’s longest standing Supporting Members. Our presenters today will be Juliana Braun, Divisional Director, CAT Analytics; Ditte Deschars, Regional Director; and Tim Fewtrell, Executive Director, Head of Catastrophe. So welcome to all. And I’ll hand over now to Ditte to get us started.
Ditte Deschars:
Thank you very much. And first of all, great pleasure to be here. We are delighted to attend this webinar. We’ve chosen a subject today which is climate change. This is a subject that it’s very close to our hearts. It’s something that the Willis Towers Watson group is working very intensively on, together with various players in the field from governments to regulators to the insurance industry, etc. And what we wanted to do, so today we’re going to look at the various aspects of climate change risk and how we help insurance companies prepare and how they can do to act in the face of these challenges. And this presentation is sort of a lead onto what we’re going to do later on in Helsinki [at ICMIF’s Meeting of Reinsurance Officials, or MORO 2020], which will probably also be a webinar considering the world we’re living in. And at that stage we will look more at the physical risk aspects of climate change, but more about that later on.
We just wanted to start with a survey that the World Economic Forum released earlier this year. They do a report which is called a Global Risk Report. And in there they performed something which they refer to as global risk perceptions. And they do these on a fairly regular basis to see how people view the risks that are facing us in the coming 10 years let’s say. And it’s quite interesting because this is the first time since this survey started that the top five risks in terms of measurements of likelihood of the events happening is actually all climate related. So if you look in the top right corner of this graph, you can see that the top risk is climate action failure, extreme weather, biodiversity loss, natural disasters, etc. And this aesthetic is the first time in the survey’s history that actually it’s one category that takes all the top five places in likelihood of events happening.
Climate change is clearly on everybody’s mind. We should say that if you’re looking at this graph, infectious diseases is top in terms of impact. You can see that it’s up in the left hand corner. But when this report was done, the likelihood was viewed as fairly low. Maybe that has changed. The view on that point has changed in the last weeks. But clearly climate change is on everybody’s mind and we think it requires a lot of long term planning and thinking and preparing for which we are going to talk you through today on what Will Re are doing to help insurance companies prepare for this.
I think we have the situation that we’re facing today, which is virus COVID-19. But I think we can all agree that what is happening with COVID-19 is that it is a catastrophic situation that has just unfolded at an incredible speed that we probably didn’t foresee could happen that it could have such a global spread. And climate change is, of course, the same. The only difference with climate change is that it is a much slower development. But that doesn’t mean that the impact is in any shape or form slower.
What we’re saying is the difference what we are facing with climate change is that there is a lot of knowledge around it. And we know, roughly, what to expect from climate change. We know roughly what will happen if we continue along the same route that we’re doing now. And we know when to expect it and how big the impact is. The problem that we have with climate change is that it’s in the hands of us humans. And unless we change our ways of doing things at the moment, we might well go to a point whereby it becomes irreversible. We will no longer be able to change and hope for a better outcome. So it is incredibly important that we prepare for climate change. It is incredibly important that we consider the multiple aspects of risk. And hopefully today we will shed a little more light on what we are doing in this field to help. Okay. So I pass it over to you, Juliana.
Juliana Braun:
Thank you very much Ditte. I just wanted to set the scene a little bit on what we know about climate change. What we know is that in the past 150 years the global temperature has increased by about 1 degree celsius. And this warming has even been stronger over the land surface. Reports now suggest that under different emission scenarios, this global warming might reach up to six degrees, compared to preindustrial levels, at the end of this century. Now, to some people, this increase might even be nice. Or they would think, “This is not very alarming.” However, we know that extremes react strongly to a relatively small changes of the mean state. And we can already see that in some of the past events of history. For example, research has seen or shown that Hurricane Katrina was intensified by climate change, resulting in an increase in precipitation, leading to increased losses coming from that.
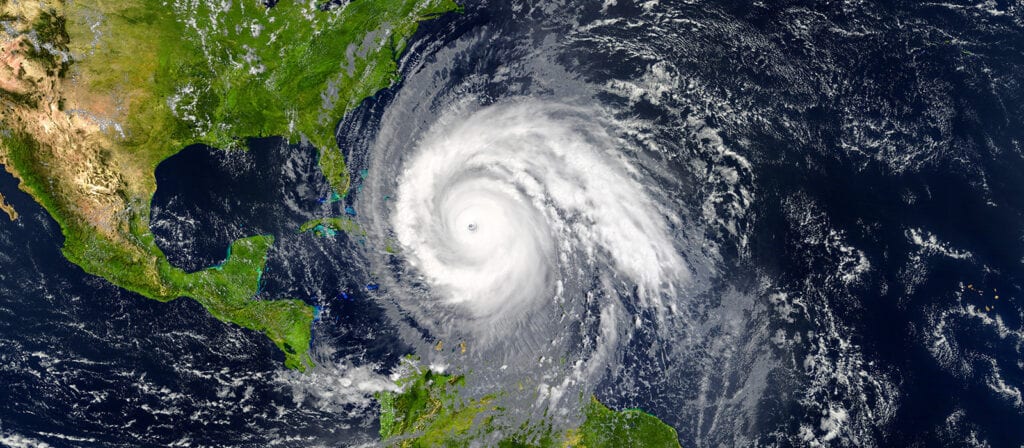
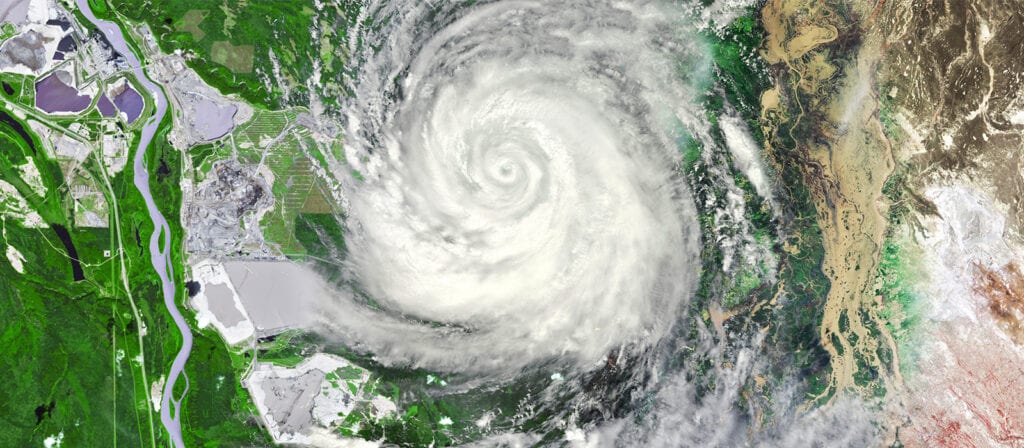
We see an overview of what physical impacts could be under different warming scenarios. These are the physical changes under different warming scenarios and different aspects that could change. For example, sea level rise might lead to coastal flooding which will lead to an increased risk in coastal areas. However, what I want to focus on today is tropical cyclones because this will also be a case study that will be presented by Tim Fewtrell later on. What we can see if that overall we will be expecting fewer tropical cyclones. However, the stronger tropical cyclones of CAT four and five, are expected to increase in future. And also, they’re expected to become wetter. So more rain associated with these tropical cyclones, and then causing higher losses.
These outsized losses and associated price increases, as well as new regulations are really forcing the industry to reassess. And also social activism is beginning to influence policy and decision making. And businesses are coming under increasing pressure to address climate risk. And, therefore, we have at Willis Towers Watson come up with a climate change framework that is designed to help our clients to evolve from thinking about climate risk to taking action.
What we’re doing here is we’re breaking down the difficult task into six steps to help approach this problem. The first step will be to define the modulation. Why do we want to be looking at this. The second one would be determining the business impact. And the third step would be applying research, collating research and actually determining practical applications of these different scenarios of how the future might work. And the fourth step, we try to assess and quantify that. So we want to identify tools that help us actually translate this increased or decreased risk and monitor returns. And the fifth step, this is the reporting step and arguably one of the most important ones. Is how do we communicate the findings from the study to key stakeholders. And in the fifth step we want to look into actions that can result from our assessment which could be, for example, risk transfer or changing the strategic direction of the company.
In the defining motivation phase, what we do generally is differentiate three different drivers of climate action. The first one is a more reactive category where we are reacting to regulatory requirements. And we see that increasingly regulators are asking for responses. And one of the very prominent examples is the U.K. PRA, which I will go into more detail in a minute. The second one would be principle based. And this could be that your company is trying to show soft leadership. Show that it is reacting responsibly and it could use, for example, climate related financial disclosures to show that you are looking at this topic already. And the third category could be showing resilience. So future proofing your business, identifying and mitigating business risk that result from climate change. And identify sustainable growth opportunities.
So, on the next slide you should see an overview of the UK PRA’s timelines and stress test timelines within their stress tests. And actually, the PRA was in 2019 the first regulator to action stress tests through their general insurance stress test which included climate change scenarios. And within a very short timeline of a couple of months, they released these scenarios and asked larger insurance companies to come up with quantification methods to show that they are thinking and are able to quantify the impact of climate change risk to their portfolio. On the right hand side you can see that different time periods were set out. So Scenario A for example would be until a year 2022. Scenario B until 2050. And Scenario C, 2100.
We have done a survey across the globe and have seen that actually though the UK PRA is really driving this action currently, there are other regulators that are also thinking about how they can incorporate such sensitivity analysis and stress tests into general insurance stress tests. So whenever you see a pinkish or purple colour, there is already something happening in those countries. And we are expecting over the next couple of months and years, this will increase.
Principle driven motivation could be to report climate related financial disclosures through TCFD. And we’ve seen that several insurers see the call to action over climate reporting as an opportunity because if they are able to show that they have prepared or are preparing for a lower carbon economy, they can have a competitive advantage over others. And we’ve seen that some larger corporations are actually spending considerable efforts in developing their plan. What we’ve also see is that a lot of ICMIF members are already actively incorporating climate change into their strategic thinking.
And down here we just see an example of Achmea. We found that on their website and it shows that they are looking to make an active contribution to the objectives of the Paris Climate Agreement, which is trying to limit global warming to below two degrees Celsius by the end of the century. On the left hand side we see a comparison from the study of June 2019 where we see that really a lot of insurance companies are starting this climate… to this closed climate related financial risks. However, compared to other sectors in some areas we are still behind. I know that there’s going to be a webinar specifically on this topic next week. So I will stop here and move on to the next slide.
Where we start determining the business impact. And it’s here where we start differentiating between different risk types. As you can see, here we differentiate between physical risks and transition and liability risks. And I’m going to go into more detail of what that means in the next slide. What we also look is how might climate change considerations be incorporated in the different elements of the company’s operations. So how does it influence the strategy? Who is going to be governing the process? What does that mean for the risk management? Are we going to include regular stress tests? And what kind of metrics do we want to use to pin down what it means?
So, moving to the next slide we have an overview of these three different risk types. So physical risk, transition risk and liability risk. We start off with the physical risk. This means the risk resulting from changing climate conditions. And that’s the direct impact to assets and properties. And the result of this physical risk would be a lower asset value, increased insurance claims or supply change disruption. An example for an increased physical risk could be higher losses from storm surge as a result of an increased sea level or even new risks arising through the increase in sea level. Which is known as sunny day flooding. So flooding resulting even if there is no rain.
The second risk category would be transition risk. This is risks resulting from policy changes, technological innovation, or social adaptation. And what it means is the risk resulting from a destruction when we move to a more low carbon economy. It can have impacts on pricing and demand. Leads to stranded assets or defaults on loans. An example for this would be if government policies were to change in line with the Paris Agreement, then two thirds of the world’s known fossil fuel reserves could not be burned. And that would change the value of investments held by banks and insurance companies in sectors such as coal, oil and gas.
The third category would be liability risk. That means stakeholder litigation and it results from not considering or not responding to the impacts of climate change. This might lead to business disruption or penalties resulting from litigation. Or we could consider this to be also kind of a generation conflict. What if future generations suffer from climate change. Who will they be holding responsible for that and will they be making claims?
If we look at what other companies are doing. Or we did an assessment and here we just looked in to the sustainability reports of different insurance companies and tried to identify how they are thinking about climate risk and how they are sponsoring this topic in their companies’ boards. How they are changing their strategy and risk management and which metrics they use? So if we focus on just the first company, A, we see that there’s board buy in, there’s even an ESG board so it’s a very important topic in this company. They have changed the strategic direction to sustainable investments and have allocated 25 billion euros to this. They are trying to move away from coal based risks and will not give insurance for these type of risks by 2040.
Within this company they have identified their largest risks to be asset related with physical risks currently being in the risk appetite. But what they’re also doing is refining their underwriting and reinsurance decisions to include future risks. And in terms of metrics and targets, they have started including sensitivity and scenario analysis which extends to the time horizons to 2040 and they include all different risk spectrum.
So, if we move on to the third step which is applying climate science to business, we want to look at how we can conduct research to determine future scenarios and estimate impact from these future pathways. Here again you can differentiate between the physical risk and the transition and liability risk. And we at Willis Towers Watson are very fortunate to have access to Willis research network, which you can see in the middle here, which helps us pick climate scenarios and temperature pathways and informs how we can translate this to hazard adjustments within models, for example.
What we have done in our climate change working group is conduct a global screening of physical climate change impact. And we have seen that the scientific understanding of climate change influence really varies across the different phenomena. You can see on the left hand side here, is a graph showing different perils. And basically it can be broken down to our capability of understanding the past and also the future. How these perils will develop in future. On the top end of this graph you can see extreme heat, extreme cold and sea level rise. And these are risks that are directly associated with increased temperature. So our ability to detect climate change in past records, and also our ability to predict what will happen here in future is a lot bigger than for risks for example. Like extra tropical cyclones, severe conductive storms or tropical cyclones.
So, now I want to show you an example of scenarios that have been outlined by the PRA in their insurance stress tests from last year. And as mentioned before we differentiate three different scenarios which relate to different timelines. Scenario A being 2022. Scenario B, 2050. And Scenario C, 2100. What they’ve laid out here are different perils that change under climate change. And if we just pick the first one, it depicts the percentage increase in surface runoff resulting from increased precipitation. And this has been quantified to be 5% in the near future, 10% in the midterm and 40% in the far future. So these are the kind of studies that we then want to incorporate in the risk assessment and actually quantify how this might look in monetary terms.
But before we dive into an example presented by Tim Fewtrell, I want to kind of set the scene by showing how different methods and different levels of how to address this issue have global exposures. You would want to choose a top down approach to look at identifying hot spots across different regions and different perils of where climate change might hit your company the most. If you are regionally, in a region specific area, you would want to look at a bottom up approach because you probably have a lot of detail on your exposure and are able to do a granular and more refined assessment of your risk. With that I will hand over to Tim who will be guiding us through the step three and step four on a specific case study which is U.S. hurricane.
Tim Fewtrell:
Thanks very much Juliana. And the next few slides sort of act as a bit of a taste of session for what we’ll be presenting in June where we’ll look at a few more examples. But we thought it’d be nice to kick off and look at one in particular at least. So you know one of the things that Juliana mentioned was that when we want to start looking at climate change, the first thing we’ve got to do is to try to understand the science and to try to understand the backdrop against which we are dealing with these perils.
The first thing to do is to see, can we currently pick up a trend in the underlying data that might signal some kind of influence of a changing climate? Right? When you start doing that, when you start looking at the past data, the historical data, what you notice actually is that there are really large fluctuations and large multidecadal, so patterns happening over many tens of years, oscillations and patterns that occur in the data naturally. And if we think about this from a tropical cyclone perspective, what we’re looking at there on the bottom left hand side, so in green is the count or the frequency of non-major hurricanes in the North Atlantic Basin. So these are what we call category one and two storms. And then in red is the count of major hurricanes, so that’s categories three and five.
There are two things that pop out when you look at this data immediately. Is number one, there’s huge variability, as I was just mentioning. And number two, you go, “Well, there’s no doubts about it. There is definitely an increasing number of hurricanes since the early 1800s.” Without a doubt you look at that data and you can say that. But what’s really important to take into account here is that we’ve gotten a hell of a lot better at recording and understanding these phenomena in the recent times. So you have to take into account that actually, our ability to observe these data has changed. And therefore, it’s likely that some part of the pattern that we’re seeing here is actually around our observing capabilities.
However, as it says here, it’s very important here. It’s virtually certain that the frequency and intensity of storms in the North Atlantic has increased since our recording period has, if you like, stabilized since the late ’70s, early ’80s when the satellite era has come in. So we have a bit of an understanding here about the current past or the current climate in which we sit and the past trends that we can see in tropical cyclones. And that’s really important to have as our basis before we start looking at any future trends.
Just to set the scene for the future trends that we’ve been looking at here, well what we’re taking as our base here is the fifth assessment report from the IPCC. So the Intergovernmental Panel on Climate Change. And what they came out with, and Juliana touched on this a little bit earlier, is what they call these four representative pathways. Or representative concentration pathways. And what we’re talking about here is these are different scenarios about how the climate may play out over the next hundred or so years, depending on the amount of CO2 in the atmosphere and that, therefore, is a direct dependent upon how much action we take.
If we just look at those scenarios we’ve got RCP 8.5, that’s that one on the bottom of the table right hand side. And that’s very simply we do nothing. That’s business as usual we carry on. While something like a RCP 4.5, that’s what we’re calling a stabilization policy is where we’re actually taking some steps to influence and to change our behaviour such that the CO2 equivalents in the atmosphere don’t go up quite as much as the business as usual. This is the research we’ve taken then when we’ve started looking at the influence of these different pathways on the occurrence of tropical cyclones.
We’ve done this… this is a study that’s been carried out by Knutson et al. that was carried out in 2013. And what they did was they used this RCP 4.5 scenario. And they used a couple of different models. And so where we’ve written CMIP 3 and CMIP 5 they’re just different climate models. They’ve used a couple of different models to look at the changes in frequency of different category, so different intensity, hurricanes for the North Atlantic for both the early and the late 21st Century. And to summarize very quickly what we see in all this is we see reduction in the frequency of categories not to three tropical cyclones. And we see an increase in the frequency of those category four and category five major, major hurricanes that really cause a lot of the damage.
To drill down that into a little bit more detail, what you’re looking at there on the bottom left hand side is the purple bar on this plot is, this is our current view of the world. This is currently what we’ve seen in our climate. So we see a frequency of 3.4 category one storms in the North Atlantic over that time period. But what you see, so that’s what the purple bars show. What the yellow and the pink bars show is two different models and their predictions of what we think will happen in the late 21st Century. And what you see then in the blue is a different model’s prediction of what we see in the early 21st Century. And basically what you can see across all of these is that the yellow, blue and pink bars are very much below the purple bar for the category not to three are occurring less frequency. And very much above the purple bar for the categories four and five. I.E. we’re going to see an increased frequency of category four and five storms as Juliana mentioned at the beginning of the presentation.
What we wanted to do is we thought we have models currently of North Atlantic hurricane risk and we can take this information and do a bit of a stress test. And so a sensitivity test to look at the impact of these changes on say an idealized portfolio. And so what we’re looking at here is the outputs of that analysis. So what we’re looking at on the right hand side is you can see the OEP curves for those various different scenarios. And on the left hand side what we’re looking at is, as I said, an idealized portfolio with an idealized reinsurance structure and looking at the exit return periods for those layers based on these different scenarios.
The first two columns here we’re talking about we’ve got our current vendor, so our model of North Atlantic hurricane risk. And both the major model vendors for North Atlantic hurricane risk have kind of a long term view and what they call a near term view or a warm sea surface temperature view. And these are just to replicate sort of different patterns that we see in the current data. And those are the various exit return periods for that.
Then what you can see on the right hand side of that table is where we’ve taken these reductions in the small categories and increases in the high category storms and looked at, therefore, the impact. And what you can see is, broadly speaking, the early 21st Century view is not wildly dissimilar from the kind of what we’re calling the near term or the warm sea surface temperature view of the vendor. Right? This is kind of what we’re seeing now. It’s relatively similar, sort of the next five years, next 10 years or so. But what you can see is that that late 21st Century view, you see a really quite dramatic decrease in the exit probability, or the exit return period. So an increase in the exit probabilities based on modelling this idealized portfolio. And what, really what we wanted to show here was just this was kind of one example. And we’ll show a few more examples when we speak in June about how we can use these various climate change sensitivity studies to look at what that’s going to do to current programs. And what that might do to how clients have to think about restructuring or at least taking into account climate change when they’re thinking about their risk transfer process.
So with that, I’ll hand over to Juliana to go through the final couple of stages of framework.
Juliana Braun:
Thanks Tim. So leading over to the next stage which is arguably one of the most important ones is when we try to report what we found during those studies to key stake holders. And here again, what you can see if the three different categories around our motivation that we defined at the beginning, regulatory, principle and resilience. And the different topics that address during the study. So if it’s regulatory driven we are using stress tests and trying to identify failure points. So the content of the report might be around the methodology and the assumptions that were taken. And also then show different risk metrics. For example, the one in 100 or the one in 200 PML. What it tries to show is capital adequacy and it will be informing the CFO and the CRO of the company.
If we look at principle driven motivation, this report will be containing climate related disclosures and maybe even use ESG score cards. It will have the content of strategy planning and commitment. And then risk metrics could be around defining the strategy of moving, for example, to 100% coal based divestment. So reducing the investments that are in coal based industries. And these will be important for stakeholders like investor management and will also be presented towards CEOs.
If resilience was your main motivation, you’re looking into investor briefing and board meetings. You want to identify or you want to lay out the different opportunities and threads and how this might impact the strategy. And you will be reporting this to CEOs, CROs or COOs. This could also have the content, for example, a metric could be the AAL that can be, or the changed annual average loss that you are expecting over time. Which could then be informing pricing for the future.
This nicely leads over to the last category where we tried to define what which actions can be taken from this risk assessment. And as Tim has already mentioned, this could just mean defining different risk transfers, products or changing the was that the reinsurance is structured. For example, you want to manage your increased frequency of volatility, you could try to restructure your reinsurance purchase. Or you could use the results for planning, for changed pricing as we’ve just seen with using the annual average loss. Or just change also the way that you guide your underwriting. So for example, if we pick up the example from the beginning, where we said there might be an increase in coastal flooding due to increased sea level, you would want to reduce your risk along coast lines.
I think we are coming to the end of our presentation. And just want to lay out again, here an overview of the six steps from motivation, business impact, applying the research, assessing and quantifying, reporting and taking action. And just lay out again that we have had some very successful case studies with some of our clients where we can help them move through these different stages and actually make this applicable to their company. And help, especially also in steps three and four, using the assistance of our Willis research network and helping quantify the change in risk.
With that, I think I will hand over back to Mike to… and open the round for questions.
Mike Ashurst:
Great. Thank you for that very important presentation. Before we get to questions, Ditte and Tim mentioned earlier in the webinar about this being a prologue to another presentation to the Meeting of Reinsurance Officials (or the MORO) on “How well do catastrophe models represent the past, present and the future?”. Now that presentation will also be delivered now as a webinar because we’ve postponed the MORO to 2021. So Tim or Ditte, could you just say a few words about what we can expect from that presentation?
Tim Fewtrell:
Of course. Happy to Mike. The idea with that one is to look in a little bit more detail at the sorts of case study that I presented today. Where we looked at, today we looked at tropical cyclones and we purely looked at the future. But what I want to do in that presentation is really run through what sort of metrics do we have available and what sorts or data do we have available to judge how well our current crop of catastrophe models can represent today’s climate. And once we have a handle on how well and if they even are representing today’s climate, how can we use metrics and approaches, like I was showing today, to start thinking about how well they might represent future climate. I hope that’s whetted everyone’s appetite.
Mike Ashurst:
Excellent, thank you. So we do have a few questions. So we will ask a few of those. I’ll leave it up to the three of you to decide who answers which question. So the first one is, have companies started changing their reinsurance purchase as a result of climate change considerations?
Ditte Deschars:
I’ll take that one. I think that climate change is a fairly slow process and as we know most of the reinsurance contracts that are bought are shorter term. I think we are talking about at least the P&C side of things. So there are no drastic quick changes. But when we’re looking at, we can see that there are changes happening to frequency of events. And we can see that there are changes potentially coming to severity of events. So yes. I think that companies are coming to tail risk protection that they are buying. And the likes of volatility protections that they are buying. But I think that they do that anyway and will continue to do so even more in the future.
But the most important thing that is happening is that they are starting to look at the interconnectivity of the various risk segments that they are facing. So not just the underwriting risk but also investment risks that they are facing for when it comes to climate change. So when we discuss with clients about climate change, we actually take all these different buckets of risks and we instead see, do they need to take different strategies across all the various buckets of risk? Which can be maybe amending a bit the reinsurance buying, but also looking at maybe hedging investment risks in a slightly different way from what they’re doing today. So it’s a slow and ongoing process. Not sure if that answered the question.
Mike Ashurst:
Okay. Thank you very much. The next one is, what are the reinsurers saying about providing capacity in the situation where more severe storms are expected?
Ditte Deschars:
I think that the appetite of the reinsurers is very much still there. So it’s not so much fear of more severe weather. I think what it’s really about is understanding the change and understanding the changing patterns of losses. So this leads us on to what we’ve been discussing today and what we’re going to talk about more in June is really exchanging the view of risk. What is the view of risk? Trying to quantify it and therefore put an appropriate price to it. So I think that is the key discussion that we are engaging with reinsurers. It’s not so much do they want to or not want to cover it? But it’s just the proper quantification of it and therefore the appropriate pricing of all the capacity that they would offer.
Mike Ashurst:
Okay, thank you. The next question, what support are insurers typically seeking? And what could you as a broker help us to achieve?
Juliana Braun:
Maybe I’ll take this one because I’ve been involved in some of the studies or the questions that we have been getting from insurance companies. And they were currently mostly driven by their regulatory response by the PRA. So what we helped here is to quantify the physical risk through scenario analysis and to actually translate that in to CAT models. So an example was shown by Tim but we also did this for our UK flood and also tried to quantify, for example, the change in subsidence risk or increased risk. And so the response to regulator was one of the big topics. But what we’ve also done is help clients who would like to have a global view and wanted to really see how to approach this, framed their thoughts and helped through this six step process to break down the different segments and what they need to look at when they start thinking about climate change. I hope that answers the question.
Obviously there are more application areas we can help with the impact on reinsurance buying or also on the contractual wording part as well.
Mike Ashurst:
Sure. In follow–up to that we said that the UK and Australian regulators are driving the discussion around stress testing climate change scenarios. Do you think other jurisdictions will pick this up? And at what pace?
Juliana Braun:
We think we can, for example in Europe, we think that probably in the next couple of months or maybe next year we will see some of the regulators, for example the FMA in Austria or the BAFA in Germany, release these kind of stress tests of all. Because they’re all looking to EIOPA who has currently has released an operation paper and an information paper. And they’re trying to align their stress tests along the lines of EIOPA. And yeah. In other regions we’re expecting this to become a much more important topic and actually translate into regulation midterm. So I would say next year or in the coming two years we will see more requirements coming up.
Tim Fewtrell:
And just perhaps to add on that one, the other jurisdiction that we know is working on it, it was sort of mentioned on the slide, but the Japanese regulator is very much looking to EIOPA in Europe and APRA in Australia for guidance over its overhaul over regulations. So I would expect Japan to be next as well. Let’s put it that way.
Mike Ashurst:
And, one more question. Is there a way to integrate other risks like natural, biological, technological in to these processes? And if so, how?
Ditte Deschars:
Definitely. I mean the framework is really agnostic to the type of risk. So we have seen that we can use it for our physical risk which would be the natural risk component. But then transition risk is basically also already talking about this technological one. So it’s really, the framework just asks the right questions. So it helps forming questions to identify which aspects need to be considered. But you can apply it to any kind of risk.
Mike Ashurst:
Okay. And I’ve just got two more. We’ll try and get through these. So from a global perspective, which country or territory do you think is a hotspot to be most affected by climate change?
Juliana Braun:
That’s a good one. This is a very, very difficult question. For one there are different perils what are playing out on different paces and in different strengths and… This is, yeah. I would say probably a hotspot would be the U.S. with hurricane and generally coastal areas because of the change in sea level rise and storm surge risk that will be increasing. But then flooding, for example, is a peril that will change significantly in different regions of the world. But it’s so localized that it’s very difficult to really say where which change will be happening. Tim, maybe you want to add to that?
Tim Fewtrell:
No I don’t. I was just going to say it’s clearly the storm surge component is the one that is the way of identifying hotspots. And obviously whether you’re talking insured or economic here or humanitarian even makes a big difference. But it’s certainly the coastal areas and the related storm surge and sea level rise risk that are the most substantial.
Mike Ashurst:
Okay. Thank you. Final one. Juliana you mentioned that insurers and reinsurers that demonstrate they are prepared for the low carbon economy will have a competitive advantage. Could you explain how or why Willis Re expects this?
Juliana Braun:
This is just showing that you’re really… You and your company are preparing shows that you are resilient. And if you are more resilient then you are a better bet for investors to invest in your company because the likelihood of defaulting is less. Or disruption through climate change is small to put it in very simple terms.
Tim Fewtrell:
And if we extend this to the mutual space or obviously the investor angle is slightly less significant here. And obviously we’ve seen the corporate social responsibility angle. And has meant that you’re probably more likely to retain customers certainly of the millennial age that find this sort of dynamic increasingly important for their own actions as well as the actions of corporations.
Mike Ashurst:
Thank you. I think that’s all we’ve got time for. So thanks again to Ditte, Juliana and Tim for taking the time to present to us today. Thanks to you all for joining us and we look forward to seeing you in future ICMIF events, virtual or otherwise.
The above text has been produced by machine transcription from the webinar recording. ICMIF has made every effort to ensure that transcriptions are as accurate as possible, however, in some cases some text may be incomplete or inaccurate due to inaudible passages or transcription errors. Listening to or watching the webinar recording will allow you to hear the full text as delivered during the webinar but this is available in English only. Our transcriptions are provided to enable members to select the language of their choosing using the dropdown menu above.